
Creating a Report
STEP 13: Creating A Report
Reports are a super powerful way to track what is going on in your area. It can give you graphical representations of your report. You can quickly look at changes and trends that are happening in your area of ministry or your geographic location or across the nation. 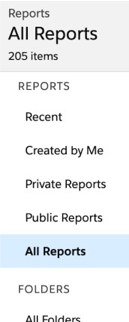

There are many reasons you may like to create a report. You may like to break down the number of courses running in an area. You may want to see number of churches in the database with no recent activity. Or see a breakdown of engagement levels across certain areas. Reports can give you great information very quickly.
(Check Appendix 1 for a list of reports you might want to create).
(Check Appendix 1 for a list of reports you might want to create).
You can see all the reports that you have access to by:
- Click on reports in the Navigation Bar
- Click on all reports on the left hand side of the screen.
- To create a new report Click on New Report
Exercise 11a – Creating a breakdown of Engagement Levels (Nationwide and for your area)
- Click on Reports on the top navigation and then click on All Reports.
- Click New Report on the top Right hand side of the screen.
- Select the Churches / Organisations option from the dropdown list.
- Click Continue.
- You will then see the basic Report screen. (Something similar to below)
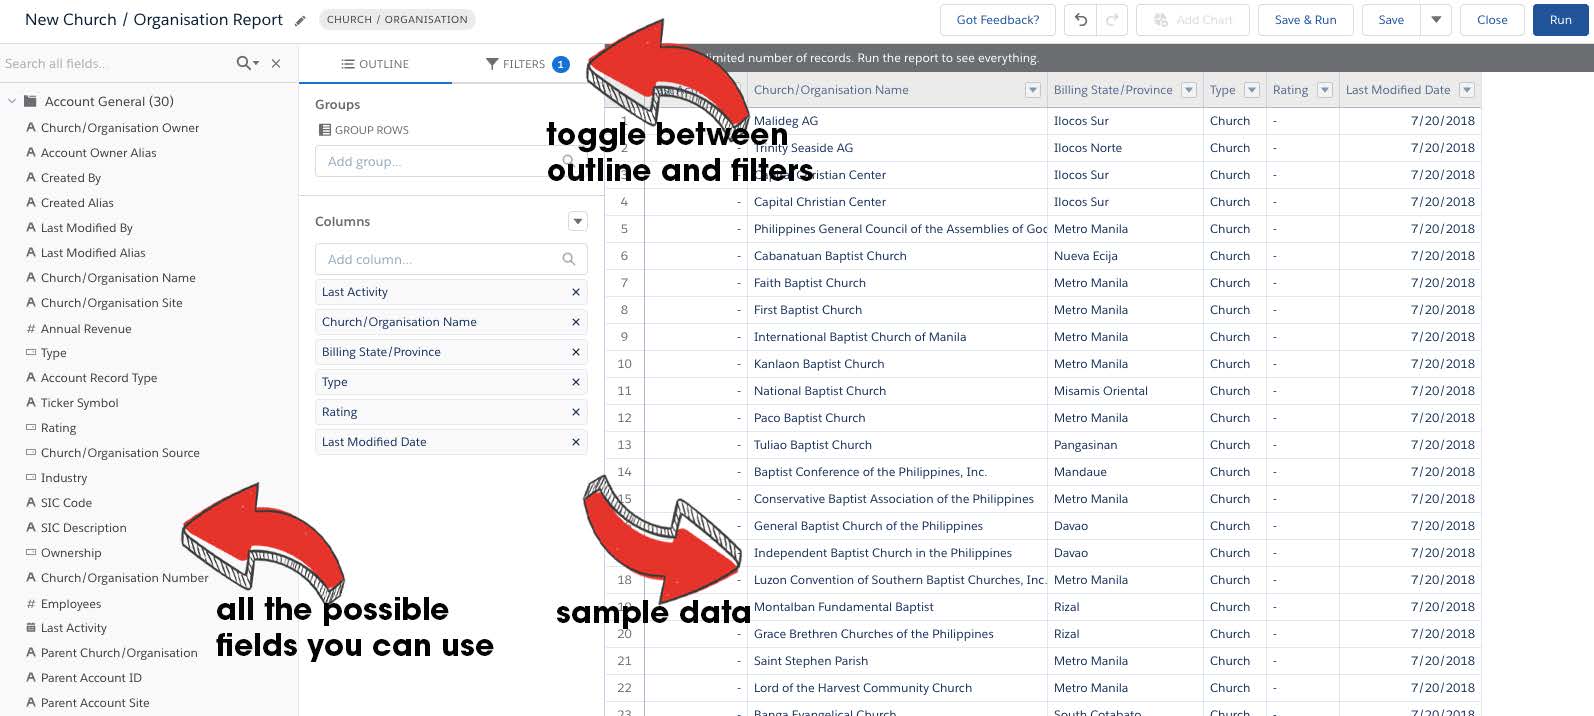
- Click on Filters.
- Set Show me: All Churches / organisations.
- Select Done. (No need to restrict by role).
- Select Date Field to: Created Date.
- Set Range to All Time.
- Click Apply.

- Click on Outline.
- In the Group Rows search box search for the field “engagement level”
- In the Columns area there are some fields that are not of interest to us and we would like to reorganise. Under Columns:
- Using Drag and Drop, drag Church / Organisation Name to the top.
- Using the search function under columns add Church Size.
- Remove Postal (or Billing) State / Province by clicking on the “x” at the end of its’ name.
- Remove Last Modified Date.
- Using the search function under columns add Postal (or Billing) City.
- Drag and Drop the fields into the order of your liking.

- To see the report you need to:
- Change the Report name to: Engagement Level of Churches (top Left Hand Side to change, look for the pencil icon)
- Click Save and Run.
- Report Description: Engagement level of all churches in the database
- Report Folder: My Personal Custom Reports
- Click Save


It will look something like this:
- Let’s add a chart.
- On the right hand side there is a button “Add Chart” Click it.
- In the chart there is a little gearbox icon, (Chart Properties) you can use this to change the chart type.
- Play with the different chart types till you get one you like.
- Press Save in the drop down arrow next to Edit (top left hand side)
If you would like the report to be just for your city / town or area then:
- Click Edit
- Filters
- In the “Add Filter” box type City.
- Leave the operator as Equals.
- Change the value to [your city]
You can also do this with postcodes and other identifying features.
----------------------------------------------------
Exercise 11b – Creating a Report Showing Upcoming Courses.
Let’s create a report that produces upcoming courses in our area.
- Click on the reports tab in the navigation bar, and click new report.
- Use the search function in the pop up window and type “Course”.
- Select: “Courses with Church / Organisation”
- Click Continue.
- In the report screen select Filters

- Change Show Me from “My Courses” to “All Courses”
- Change Date Field to Start Date / Time
- Under Range select: Current and Next month (this will continuously update)
- Click Apply.
- In the Add Filters Box type “City”.
- Choose the value with more information, most likely, Church / Organisation Postal City.
- Leave the operator as Equals.
- Change the value to [your city / town].

- Click Apply.
- Click on Outline.
- Using the Add Column box add: Course Administrator; Materials Used; Phone Number; Email; and Engagement Level.
- Change the name of the Report to: Upcoming Courses in [your city / town].
- Click Save and Run.
- Enter the Description: Upcoming courses in the next 2 months in [city in your country].
- Report Folder: Private Reports
- Click Save.


NO GRAPH?? WHAT’S GOING ON??
You can only create a graph on a report if you have a Grouped Row. You could go back into the exercise above and group by engagement level. Or you could group by church size or something else that was relevant to you. This would then enable you to add a chart.
Exercise 11c - Create a report showing a report with the number of churches with no activity by state / province (or city / town)
- Click on the Reports in that navigation bar and click New Report.
- Select: Churches / Organisations .
- Click Continue.
- In the report screen select filters.
- Change Show Me to “All Churches”.
- Click Done.
- Change the date field to created date.
- Change the range to “All Time”.

- Type in the Add Filter, “Type”.
- Select “Church” as the value.
- Click Apply.

- Click on Outline.
- In the Group Rows box type: Postal (or Billing) State / Province.
- In the Group Columns box type: Last Activity
- In the preview on the right hand side of the screen you will see that it has created a table. (See below)

- Click on the Drop Down arrow next to Last Activity.
- Select “Group Dates By” and then “Calendar Month”.
- Change the name of the Report to: Last Activity With Church by State (or Province depending on your country).
- Click Save and Run.
- Report Description: Tracking how many churches have no activity and looking at when was the last activity with the rest of our churches.
- Save in Private Reports.
- Add a Stacked Bar chart.


YOU CANNOT…
You cannot break the system by playing with reports! Please play. Try things see if you can look at your data in a variety of ways.